TinySA
TinySA Ultra
The TinySA Ultra is the spectrum analyzer every RF hobbyist should own first. For $135 you get a 4-inch touchscreen, 6 GHz coverage, and a built-in signal generator. It won't replace a $3,000 Siglent or Rigol SA, but it will tune antennas, check harmonics, and characterize filters better than any $135 tool has a right to. This is the Rigol DS1054Z moment for spectrum analyzers.
Key Specifications
| Frequency Range | 0.1 MHz – 6 GHz |
| Dynamic Range | 70 dB |
| Noise Floor (DANL) | -102 dBm |
| Resolution Bandwidth | 0.3 kHz – 10 MHz |
| Signal Generator | Yes |
| Display | 4" color touchscreen |
| Battery Powered | Yes |
| Connectivity | USB-C (charging + data) |
What We Like
- ✓4-inch color touchscreen is a massive upgrade over the original TinySA
- ✓Built-in signal generator doubles as a tracking generator for filter characterization
- ✓Battery powered — take it to antennas, field day, or the bench without cables
- ✓Active firmware development with regular feature additions
- ✓Frequency range covers everything from LF through 6 GHz — HF, VHF, UHF, WiFi, Bluetooth
Limitations
- ✗Dynamic range and phase noise are hobbyist-grade, not lab-grade
- ✗Screen can be hard to read in direct sunlight
- ✗Menu system has a learning curve — expect to read the manual
- ✗No PC software for remote control or screenshot capture
Overview
The TinySA Ultra is the spectrum analyzer that finally puts RF analysis within reach of hobbyists who previously had to guess, listen, or simply do without. At $134.99, it occupies a price point that would have been unthinkable for a handheld spectrum analyzer just five years ago. The specification list reads like something from a much more expensive instrument: 100 kHz to 6 GHz coverage, a built-in signal generator, a 4-inch resistive touchscreen, microSD card storage, and PC control over USB. For ham radio operators, WiFi troubleshooters, antenna builders, and anyone curious about what actually occupies the airwaves around them, the TinySA Ultra is a genuinely disruptive tool.
But the price is also a warning label. A $134 spectrum analyzer cannot be a Keysight, a Rohde & Schwarz, or even a Signal Hound. The TinySA Ultra makes fundamental trade-offs in dynamic range, noise floor, absolute amplitude accuracy, and measurement speed to hit this price. The critical question is whether those trade-offs matter for the work you actually do -- or whether they render the instrument useless for your application. After extensive bench time and community testing, the answer is nuanced: the TinySA Ultra is remarkably capable within its limits, and dangerously misleading if you treat it like professional gear.
The core use case is clear. If you need to identify what frequency a signal is on, check whether your transmitter is clean, measure harmonic content, find interference sources, or verify antenna performance in the field, the TinySA Ultra delivers genuinely useful data. If you need to certify EMC compliance, characterize phase noise below -90 dBc/Hz, or measure signals buried more than 70 dB below a carrier, you need to look elsewhere. Understanding where that line sits is the key to getting value from this instrument.
Design & Build Quality
The TinySA Ultra is a handheld unit measuring roughly 90 x 140 x 25 mm and weighing around 200 grams with the internal battery installed. It fits comfortably in one hand, and the 4-inch 480 x 320 resistive touchscreen dominates the front panel. The enclosure is plastic -- functional but not rugged -- and the unit feels like a consumer electronics device rather than a test instrument. That's fine for bench or indoor field use, but dropping it onto concrete would likely crack the case or damage the screen.
RF connectivity is via a single SMA female connector on the top edge, shared between spectrum analyzer input and signal generator output. There is no separate tracking generator port, which means you cannot simultaneously use the spectrum analyzer and signal generator functions -- a significant limitation for filter sweeps and insertion loss measurements. The maximum input level is +6 dBm with 0 dB internal attenuation, and the unit includes ESD protection, though community reports suggest the input mixer remains vulnerable to damage from strong nearby transmitters. An external attenuator is strongly recommended for any work near transmitters or power amplifiers.
Power comes from an internal 3000 mAh lithium battery providing approximately two hours of continuous operation, or via USB-C for charging and PC connectivity. The USB-C port is also the control interface for the PC application. A 32 GB microSD card is included for saving screenshots, traces, and measurement data. The resistive touchscreen requires a firmer press than modern capacitive screens, and many users find the included stylus more precise than a fingertip. The display is readable indoors but washes out in direct sunlight -- a common limitation at this price point.
Performance & Specifications Deep Dive
The frequency range splits into two distinct operating modes. In normal mode, the TinySA Ultra covers 100 kHz to 800 MHz using fundamental mixing. In Ultra mode, harmonic mixing extends coverage to 6 GHz. This distinction matters enormously for performance. Normal mode delivers the best sensitivity, lowest noise floor, and cleanest spectral display. Ultra mode sacrifices approximately 10 dB of noise floor performance above 3 GHz and 25 dB above 5.3 GHz, according to the manufacturer's own specifications and verified by independent EEVblog community tests. The displayed noise floor in Ultra mode above 5 GHz can approach -40 dBm under some conditions -- barely adequate for strong signal detection and completely unsuitable for weak signal analysis.
The specified dynamic range is 70 dB at 30 kHz RBW, which is modest by professional standards. A benchtop spectrum analyzer typically offers 100 dB or more. In practice, this means you cannot simultaneously see a strong carrier and its very low-level spurious emissions in a single span. You'll need to zoom in on the spur region with different reference level settings. The minimum RBW of 200 Hz allows reasonable frequency resolution for close-in analysis, but sweep times become painfully slow at narrow RBW settings -- community reports cite 20+ seconds for a 10 kHz span at 200 Hz RBW, compared to milliseconds on a professional analyzer.
Amplitude accuracy is specified at +/- 2 dB after calibration, which is acceptable for relative measurements but marginal for absolute power measurement. Independent tests against calibrated signal generators show the TinySA Ultra typically tracks within 1-2 dB of expected values at lower frequencies, with accuracy degrading above 3 GHz. The built-in calibration signal generator (1 MHz to 30 MHz, square wave) enables self-calibration, and the unit should be recalibrated periodically -- especially when operating across wide temperature ranges.
The built-in signal generator outputs sine waves from 100 kHz to 800 MHz and square waves up to 4.4 GHz. It supports AM, narrow FM, and wide FM modulation. Output level accuracy is +/- 2 dB between -72 dBm and -18 dBm. The generator is useful for stimulus-response measurements, injecting test signals, and aligning receivers, but it is not a replacement for a dedicated RF signal generator. The square wave output above 1 GHz is essentially a comb generator with rapidly decreasing harmonic amplitudes -- useful for frequency response checks but not for clean single-tone generation.
Software & User Experience
The on-device interface runs on a resistive touchscreen with a menu structure that is reasonably intuitive after a learning period. The main screen shows the spectrum trace with configurable markers, reference level, and span. Touching the display places markers, and pinch gestures adjust the span -- though the resistive screen makes pinch gestures less reliable than on capacitive displays. Menu navigation uses on-screen buttons, and common functions like changing center frequency, span, and RBW are accessible within two or three taps.
The PC control software (tinysa-app) connects via USB and implements a CDC serial protocol with comprehensive command access. Windows drivers install automatically; Linux support is built into the kernel. The PC interface provides a larger display, easier data export, and screenshot capture. Third-party tools like the tinySA Ultra phase noise measurement application extend functionality beyond the stock software. The command set is documented and accessible, making the TinySA Ultra surprisingly hackable for automation and custom measurement scripts.
Firmware updates come from the developer's GitHub repository and are actively maintained. The development community around TinySA is one of its genuine strengths -- the designer (from Eindhoven, Netherlands) maintains an extensive wiki, responds to bug reports, and releases regular firmware improvements. New features and performance enhancements continue to appear months after release. That said, some firmware versions have introduced regressions. One EEVblog user reported spurious spectral shoulders at 500 MHz with firmware version 196 that disappeared when reverting to version 175. As with any community-supported tool, staying on a stable firmware release and reading release notes before updating is prudent practice.
Real-World Use Cases
Antenna tuning and VSWR estimation is where the TinySA Ultra earns its place on the bench. While it is not a vector network analyzer and cannot measure true VSWR directly, you can use the signal generator output with a return loss bridge to estimate antenna resonance and match quality. Connect the signal generator to the bridge, the bridge to the antenna, and the bridge's detection port to the TinySA Ultra input (switching between generator and analyzer modes). The resulting return loss curve gives you a clear picture of where the antenna is resonant and how wide the bandwidth is. It is a two-step measurement requiring mode switching, but it works well for ham radio antennas, WiFi antennas, and IoT device antennas from 100 kHz through 800 MHz. Above 800 MHz, the signal generator uses square wave harmonics, and the measurement quality degrades accordingly.
Harmonic and spurious emission checking on transmitters is another primary use case. Whether you're building a QRP transmitter, testing a WiFi module, or checking a handheld radio for cleanliness, the TinySA Ultra lets you see harmonics, broadband noise, and spurious products. The 70 dB dynamic range is sufficient to catch grossly out-of-spec emissions, though it won't reveal marginal spurs that a professional analyzer would flag. For hobbyist transmitter development and pre-compliance screening, it is genuinely useful. One community user noted they use their TinySA Ultra as a sacrificial front-end -- they check questionable signals on the $135 analyzer before connecting their expensive professional gear.
Field interference hunting and signal identification is where the handheld form factor shines. Walk around with the TinySA Ultra and a small antenna, and you can identify what signals are present in your environment. Finding the source of WiFi interference from a microwave oven, identifying the frequency of a mysterious carrier, or checking whether your neighbor's cheap LED driver is polluting the HF bands are all practical tasks. The battery provides enough runtime for a couple of hours of field work, and the microSD card lets you save traces for later analysis.
Filter characterization is possible but limited by the lack of a true tracking generator. Since the spectrum analyzer and signal generator cannot operate simultaneously, you must sweep the generator in discrete steps and manually read the analyzer response at each step, or use external software to automate the process. This is slow and tedious compared to a VNA or a spectrum analyzer with built-in tracking generator. For rough characterization of low-pass, high-pass, and bandpass filters, it works. For precise filter alignment or group delay measurement, it does not.
Who Should Buy (And Who Shouldn't)
Buy the TinySA Ultra if you're a ham radio operator who needs to check transmitter harmonics, verify antenna resonance with a return loss bridge, or hunt for interference in the HF, VHF, and UHF bands. The coverage through 6 GHz also handles 2.4 GHz WiFi, Bluetooth, LoRa, and most ISM bands. At $134.99, it is the cheapest entry point into genuine spectrum analysis, and it delivers real, useful data for these applications.
Buy it if you're an IoT or embedded developer who needs to verify that your wireless module is transmitting on the correct frequency, check for spurious emissions during prototyping, or debug RF front-end issues. The ability to see what's actually happening in the frequency domain -- rather than guessing from range tests -- accelerates RF debugging significantly.
Buy it if you're a hobbyist RF experimenter who builds amplifiers, filters, oscillators, or antennas. The TinySA Ultra provides measurement feedback that was previously unavailable at this price. You can see whether your oscillator is running, whether your amplifier is producing harmonics, and whether your filter is passing the right frequencies.
Don't buy it if you need to perform EMC pre-compliance testing to regulatory standards. The dynamic range, amplitude accuracy, and noise floor are insufficient for reliable margin measurements. Don't buy it if you need to characterize phase noise, measure very low-level spurious signals, or perform precision absolute power measurements. Don't buy it if you need a tracking generator for swept filter measurements -- the mode-switching limitation makes this impractical for production work. And don't buy it if you expect professional-grade build quality and reliability; this is a hobbyist tool that requires reasonable care.
Alternatives Worth Considering
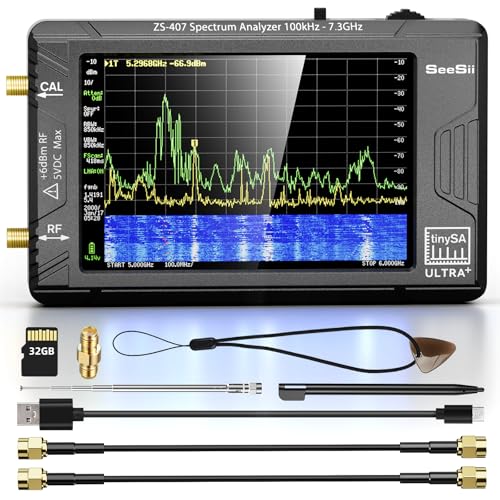
The SeeSii TinySA Ultra+ ZS406 at $139.99 is the closest competitor and successor to the original Ultra. It extends normal mode coverage from 800 MHz to 900 MHz (covering the 868 MHz ISM band), increases battery capacity from 3000 mAh to 5000 mAh for three hours of runtime, and improves phase noise performance. The Ultra+ uses the same firmware and is physically almost identical. For only $5 more, the Ultra+ is arguably the better buy unless you find the original Ultra on a significant sale.
The original tinySA (non-Ultra) at around $59 is still available and covers 10 kHz to 960 MHz with a smaller 2.8-inch screen and 650 mAh battery. If your work stays below 1 GHz and you don't need the Ultra mode harmonic mixing above 800 MHz, the original tinySA saves money while delivering similar fundamental-mode performance. The 4-inch screen and extended battery of the Ultra are meaningful quality-of-life improvements, however.
For users who need true vector network analysis -- S11 and S21 measurements, Smith chart display, impedance matching -- a NanoVNA-H or NanoVNA-H4 is the complementary tool. A spectrum analyzer and a VNA serve different but overlapping purposes. The TinySA Ultra is better for identifying signals and checking emissions; the NanoVNA is better for antenna tuning and filter characterization. Many hobbyists end up owning both.
If you need professional-grade performance, the used market offers options like the HP/Agilent 8560 series, R&S FSEA, or Anritsu MS266x series analyzers in the $500-1500 range. These provide dramatically better dynamic range, lower noise floor, faster sweep speeds, and tracking generators -- but they are benchtop units weighing 10+ kg, consuming significant power, and requiring calibration. The TinySA Ultra wins on portability and price; professional gear wins on every performance metric.
Frequently Asked Questions
Can the TinySA Ultra measure VSWR directly?
How accurate is the amplitude measurement?
What is the difference between Normal mode and Ultra mode?
Can I use the TinySA Ultra as a tracking generator for filter sweeps?
Is the TinySA Ultra safe to use near transmitters?
How does the PC software compare to using the touchscreen?
Should I buy the original TinySA Ultra or the Ultra+ ZS406?
Can the TinySA Ultra decode digital signals or modulation?
TinySA Ultra
$260.9 — 0.1 MHz – 6 GHz · Signal gen included